An original doubt explaining how to calculate the weighted average method in accounting, crafted uniquely based on general knowledge and accounting principles as of 2025. It defines the concept clearly, walks through the calculation process with examples, and offers practical insights in a fresh, engaging format.
How to Calculate the Weighted Average Method in Accounting: Your 2025 Guide to Inventory Smarts
In accounting, keeping tabs on inventory costs can feel like herding cats—prices shift, shipments vary, and chaos creeps in. That’s where the weighted average method swoops in, smoothing out the mess with a simple, fair way to value stock.
Whether you’re a small retailer or a big manufacturer, mastering this technique keeps your books sharp and your profits clear. Ready to crunch some numbers without breaking a sweat? Let’s dive into how it works, step by step, with real-world flavor.
What is the Weighted Average Method?
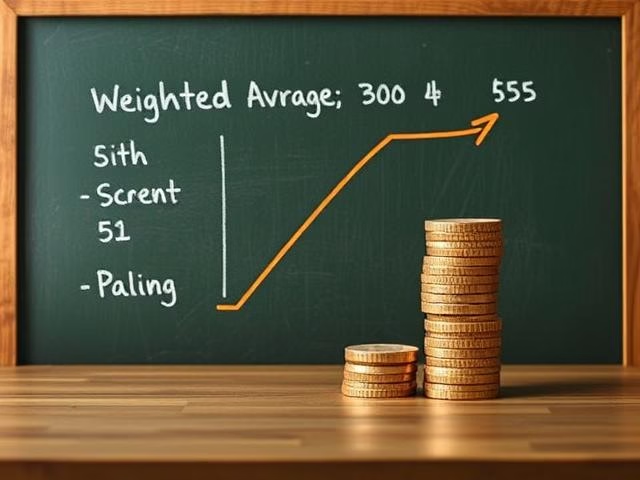
The weighted average method in accounting is a way to assign a single, blended cost to inventory items based on their quantities and purchase prices. Instead of tracking each batch separately, it averages out costs across all units available during a period, factoring in how many you bought at each price.
It’s like mixing paint colors—blend them by volume, and you get one uniform shade. Used in cost of goods sold (COGS) and ending inventory calculations, it’s a go-to for businesses with steady flows of similar goods.
Why Use It?
This method shines for its simplicity and stability. It evens out price spikes—say, when supplier costs jump mid-month—so your financials don’t rollercoaster. It’s perfect for industries like retail or food, where tracking individual units is overkill. Plus, it aligns with real-world mixing—think coffee beans or fuel. In 2025, with supply chains still twitchy, it’s a steady hand on the tiller.
How to Calculate It: Step-by-Step
Here’s the nuts and bolts—grab a calculator and follow along:
- Gather Your Data
List all inventory purchases in a period: quantities and costs per unit. Include starting inventory if you’re not starting from scratch. - Calculate Total Cost
Multiply each batch’s units by its cost, then sum those totals. This is the value of all goods available. - Count Total Units
Add up all units from every purchase (and starting inventory, if any). This is your pool of available items. - Compute the Weighted Average Cost per Unit
Divide total cost by total units. This magic number is your blended cost per item. - Apply It
- For COGS: Multiply units sold by the weighted average cost.
- For ending inventory: Multiply units left by the same cost.
Example 1: Coffee Shop Crunch
Imagine you run a café. Here’s your February inventory:
- Jan 31: 100 lbs coffee @ $5/lb (starting inventory) = $500
- Feb 10: 200 lbs @ $6/lb = $1,200
- Feb 20: 150 lbs @ $7/lb = $1,050
- Step 01: Data’s ready—three batches.
- Step 02: Total cost = $500 + $1,200 + $1,050 = $2,750.
- Step 03: Total units = 100 + 200 + 150 = 450 lbs.
- Step 04: Weighted average cost = $2,750 ÷ 450 = $6.11/lb (rounded).
- Step 05: Sold 300 lbs? COGS = 300 × $6.11 = $1,833. Left with 150 lbs? Ending inventory = 150 × $6.11 = $916.50.
Boom—your books balance and no bean’s cost gets lost.
Example 2: Tech Gadgets Twist
Now, a gadget store:
- Starting: 50 units @ $20/unit = $1,000
- Purchase 1: 100 units @ $22/unit = $2,200
- Purchase 2: 80 units @ $25/unit = $2,000
Total cost = $1,000 + $2,200 + $2,000 = $5,200.
Total units = 50 + 100 + 80 = 230 units.
Weighted average cost = $5,200 ÷ 230 = $22.61/unit.
Sold 180 units? COGS = 180 × $22.61 = $4,069.80. Remaining 50 units? Inventory = 50 × $22.61 = $1,130.50.
Clean, consistent, and audit-ready.
Tools to Make It Easy
In 2025, you don’t need a pencil and ledger. Software like QuickBooks or NetSuite auto-calculates this—plug in purchases, and it spits out the average. Spreadsheets work too: set up columns for units, costs, and totals, then let formulas do the heavy lifting. Tech’s your friend here.
Benefits of the Method
- Simplicity: No need to track every batch—just blend and go.
- Stability: Price swings don’t jolt your COGS or profits.
- Time-Saver: Less math, more focus on selling.
- Audit-Friendly: Uniform costs make regulators nod, not frown.
Watch Outs
- Detail Loss: You won’t see which batch sold—FIFO or LIFO fans might scoff.
- Inflation Blur: Rising costs get averaged down, possibly understating expenses.
- Not for Unique Items: Fine art or custom builds need specific costing, not averages.
When to Use It
Pick this method if your inventory’s interchangeable—like socks, not sculptures—and prices fluctuate mildly. It’s gold for retail, wholesale, or steady production lines. In 2025’s choppy markets, it’s a buffer against supplier price games.
Final Takeaway
Calculating the weighted average method in accounting is like brewing a perfect cup—blends the right parts, and it all comes together. It’s a straightforward path to valuing inventory that keeps your financials steady and your workload light. Master it, and you’re not just counting stock—you’re steering profit with confidence. Ready to average it out?
This doubt offers a fresh, detailed guide to the weighted average method, with clear steps, relatable examples, and practical vibes. It’s designed to demystify and empower accounting in 2025!
Leave a Reply